Vadrec da Fedoz
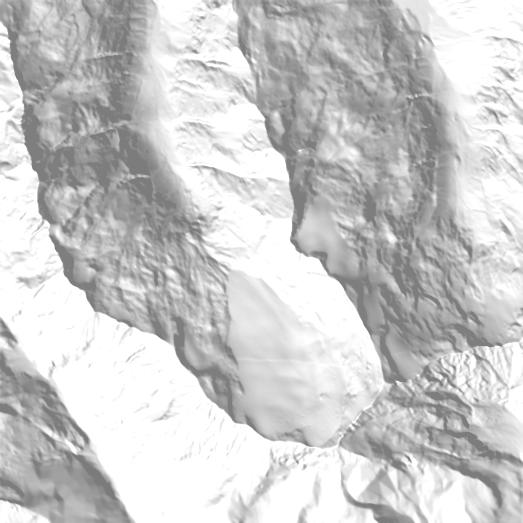
Past extents come from the Swiss Glacier Inventories of 1850, 1931, 1973 and 2016. Future extents are illustrative: each glacier’s projected area (OGGM, median of CMIP6 climate models) is removed from its lowest ice upward. About the scenarios.
Vadrec da Fedoz is the 88th-largest glacier in Switzerland, covering 1.90 km² in the canton of Graubünden. Its ice spans 2,589 to 3,338 m and faces north-west. Its meltwater drains to the Inn and on to the Black Sea. In 1850, at the end of the Little Ice Age, it covered 3.38 km²; by 2016 it had lost 44% of that area. Between 1991 and 2022 its surface dropped by 33 m on average. With strong climate protection (SSP1-2.6), about 1% of its 2020 ice would remain in 2100. With very high emissions (SSP5-8.5) it would be gone around 2051. Its meltwater peaked around 2023.
What remains in 2100
Meltwater
Million m³ of water per year, 11-year mean
The record
Thinning since 1991
Average change in surface height, from comparing elevation models made from maps, aerial images and laser scans.
Facts
Area over time
Past areas are the ice body this glacier belonged to at the time. Projections: OGGM median, SSP2-4.5.
- SGI id
- E26-01
- Canton
- Graubünden
- River
- Inn → Black Sea
- Basin
- Inn
- Location
- 46.3400° N, 9.7720° E · swisstopo map
- Elevation
- 2,589–3,338 m, median 2,951 m
- Slope, aspect
- 19°, north-west
- Debris cover
- 0.01 km² (0% of the area)
- Inventory image
- 2015
- Ice volume (model)
- ≈ 0.063 km³ in 2020 (OGGM)
- RGI ids
- RGI60-11.02222, RGI60-11.02234, RGI60-11.02248, RGI60-11.02253
More in the Inn basin
- Vadret da Morteratsch14.93 km²
- Vadret da Roseg6.58 km²
- Vadret da Tschierva5.63 km²
- Vadret Tiatscha1.87 km²
- Vadret dal Tremoggia1.83 km²
- Vadret da Grialetsch W1.15 km²
- Vadret da Sarsura0.89 km²
- Vadret da Misaun0.84 km²
- Vadret da Grialetsch E0.83 km²
- Vadret da Chalaus0.62 km²
- Vadret Calderas0.61 km²
- Vadret da Fex0.58 km²
Sources
- Linsbauer et al. (2021). The new Swiss Glacier Inventory SGI2016. Frontiers in Earth Science 9. doi.org/10.3389/feart.2021.704189
- Mannerfelt et al. (2022). Halving of Swiss glacier volume since 1931 observed from terrestrial image photogrammetry. The Cryosphere 16. doi.org/10.5194/tc-16-3249-2022
- GLAMOS – Glacier Monitoring Switzerland. www.glamos.ch
- Zekollari et al. (2024). Twenty-first century global glacier evolution under CMIP6 scenarios and the role of glacier-specific observations. The Cryosphere 18 (OGGM v1.6 projections). tc.copernicus.org/articles/18/5045/2024/
Relief: swisstopo swissALTIRegio. 1850 and 1973 outlines: Maisch et al. (2000), Müller et al. (1976), Paul (2004). Length, mass balance and volume change: GLAMOS releases 2025. All sources and methods.